
Bill Lamie, President and CEO at PX5 RTOS
PX5 RTOS is now tightly integrated with Percepio’s Tracealyzer.
Debugging in the dark is a tough task! We’ve all been there—hours before an important firmware release the system crashes and there is a mad scurry to identify and correct the offending code. In most cases, developers will be able to derive the instruction that caused the crash as well as the register contents at the time of the crash. Savvy developers might be able to dig into memory and figure out the currently executing thread and perhaps some of the C call stack. Sometimes this is enough information, but in many cases the reason for the crash is more complicated—a result of a rare timing condition of thread execution and interrupt events.
Recently, PX5 announced integration with Percepio’s Tracealyzer (www.percepio.com), which is a powerful software tool used for visualizing and analyzing real-time embedded systems. When used in conjunction with an RTOS (Real-Time Operating System) like PX5 RTOS, it offers many benefits, including the following:
 Visualization of Real-Time Behavior:
Tracealyzer provides a graphical representation of the system’s behavior, allowing developers to visualize the execution flow, thread scheduling, interrupts, and interactions between different components in real time. This visualization helps in understanding system behavior and performance.
Debugging and Performance Analysis:
With Tracealyzer, developers can identify and troubleshoot issues such as timing problems, deadlocks, priority inversions, and resource conflicts in real-time systems running on PX5 RTOS. It allows for deep analysis by pinpointing where and when issues occur.
Thread Analysis:
Tracealyzer offers insights into thread execution, context switching, and thread interactions. It helps in optimizing thread scheduling, identifying priority inversion problems, and ensuring efficient use of system resources.
Interrupt Handling Analysis:
It allows developers to track and analyze interrupts, enabling them to understand interrupt latency, handler execution times, andinteractions between interrupts and threads.
Resource Utilization Monitoring:
It provides visibility into resource utilization, including CPU usage, memory allocation, and system-wide performance metrics. This information aids in optimizing resource allocation and system performance.
Timing Analysis and Latency Measurement:
It allows for accurate measurement and analysis of timing behavior, including thread response times, communication delays,
and overall system latency. This is crucial for meeting real-time constraints.
Visualization of Communication and Synchronization:
Developers can visualize communication mechanisms such as message passing, semaphore usage, and synchronization primitives, enabling better understanding and optimization of inter- thread communication.
Verification of System Behavior:
Tracealyzer helps in validating system behavior against expected specifications and timing requirements. It assists in ensuring that the system operates as intended under different conditions.
Improved Development Workflow:
By providing a visual representation of system behavior and performance, Tracealyzer streamlines the development workflow by facilitating faster debugging, optimization, and validation cycles.
Training and Documentation:
Tracealyzer’s visual representations can be valuable for training purposes and documenting system behavior for future reference or for sharing insights among team members.
System visualization saves the day!
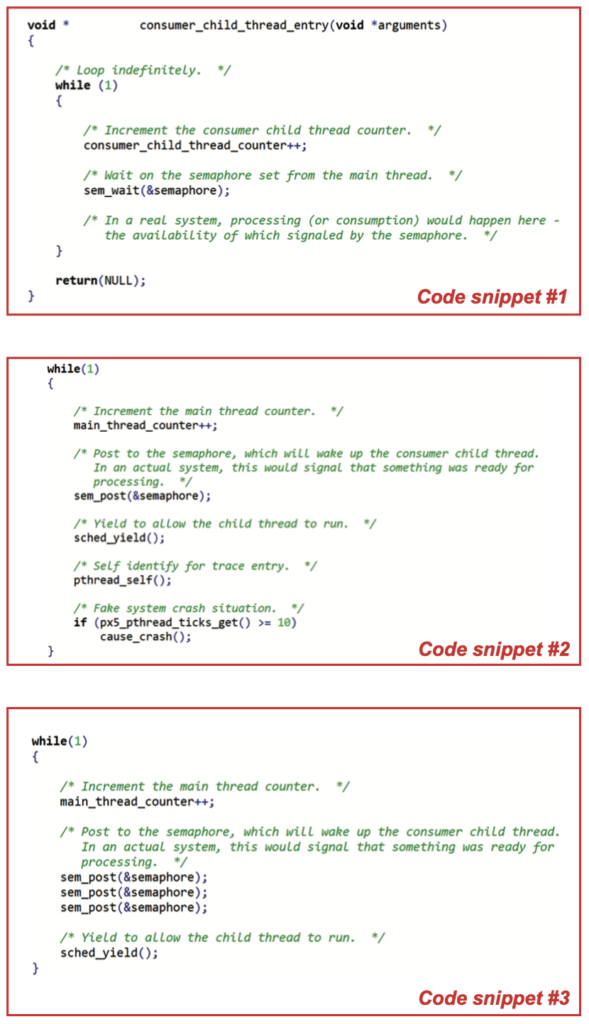
Going back to the aforementioned crash scenario, can you imagine how beneficial it would be to have a complete history of what was happening scenario, can you imagine how beneficial it would be to have a complete history of what was happening in the system prior to the crash? Instead of just basic information like the offending instruction location and register contents, the PX5 RTOS integration with Tracealyzer makes it possible to see all the execution of the system prior to the crash. To illustrate this further, consider Code Snippet #1, which shows an example “child thread.” Next, consider Code Snippet #2, which shows the “main thread” that forces a crash after 10 timer interrupts.
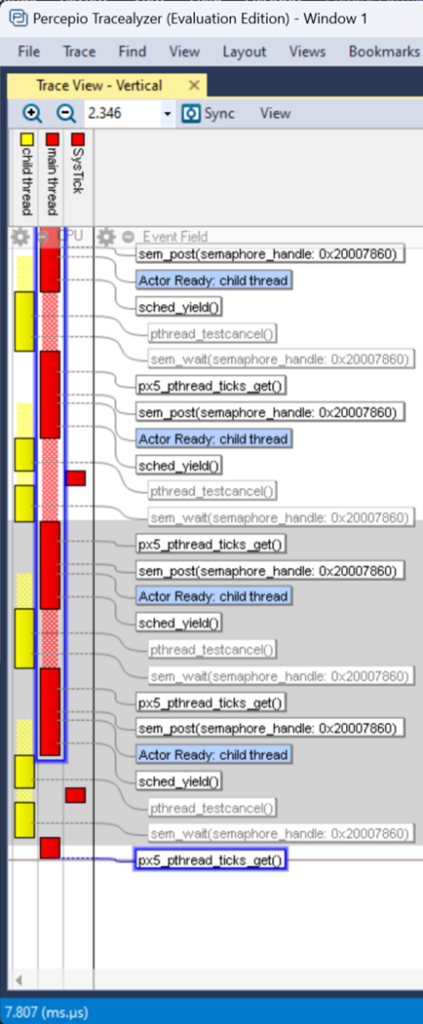 Without visualization, we would have just the instruction address inside of “cause_crash” and possibly the processor’s register contents. However, with the visualization provided by Tracealyzer, we can see a complete history of system events that occurred immediately before the system crash. Specifically, we can see that the “main thread” was running at the time of the crash and the crash occurred immediately after the call to “px5_pthread_ ticks_get()” as shown in the screenshot to the right.
We can also see that the “child thread” (yellow bars) was running previously until it suspended by calling “sem_ wait()”. Going further back, we can also see the SysTick interrupt (red) occurred within the “child thread” processing. The amount of historical information visualized by Tracealyzer is bounded only by the size of the trace buffer supplied by the application.
Generally, rare crash conditions are a result of unusual thread execution, which is hard or even impossible to understand without a visualization tool like Tracealyzer. Without such visualization, debuggingcrashes requires significantly more time and developer cycles and can very well delay a firmware release.
With greater understanding comes greater optimization
It’s hard to optimize at the system level if you don’t understand system level processing. Visualization makes it possible to understand the system-level behavior so it can be optimized. Take the same example as before, but where the “main thread” posts the semaphore three times instead of just once. The updated code for the “main thread” is shown in Code Snippet #3.
If the “child thread” is higher-priority than the “main thread,” there will be preemption (context-switch) after each semaphore post from the “main thread”. If it is necessary to immediately start the processing in the “child thread” for each semaphore posted, then this behavior is acceptable. However, if it’s okay to defer the processing of the “child thread” until all the semaphore posts have been made, two preemptions (context-switches) can be avoided (optimized out).
By making the priorities of the “child thread” and the “main thread” the same, we eliminate the preemption (context-switch) after each “sem_post()” API returning the processing cycles for two unnecessary context-switches back to the application. With this system-level optimization, the “child thread” runs only after the “sched_yield()” API call. This is one simple example of how visualization helps facilitate optimization.
In summary, integrating Tracealyzer with PX5 RTOS enhances developers’ abilities to analyze, debug, and optimize real-time embedded systems. It offers a comprehensive view of system behavior, aiding in the development of more efficient, reliable, and predictable embedded applications.